GLOBALVARS
0
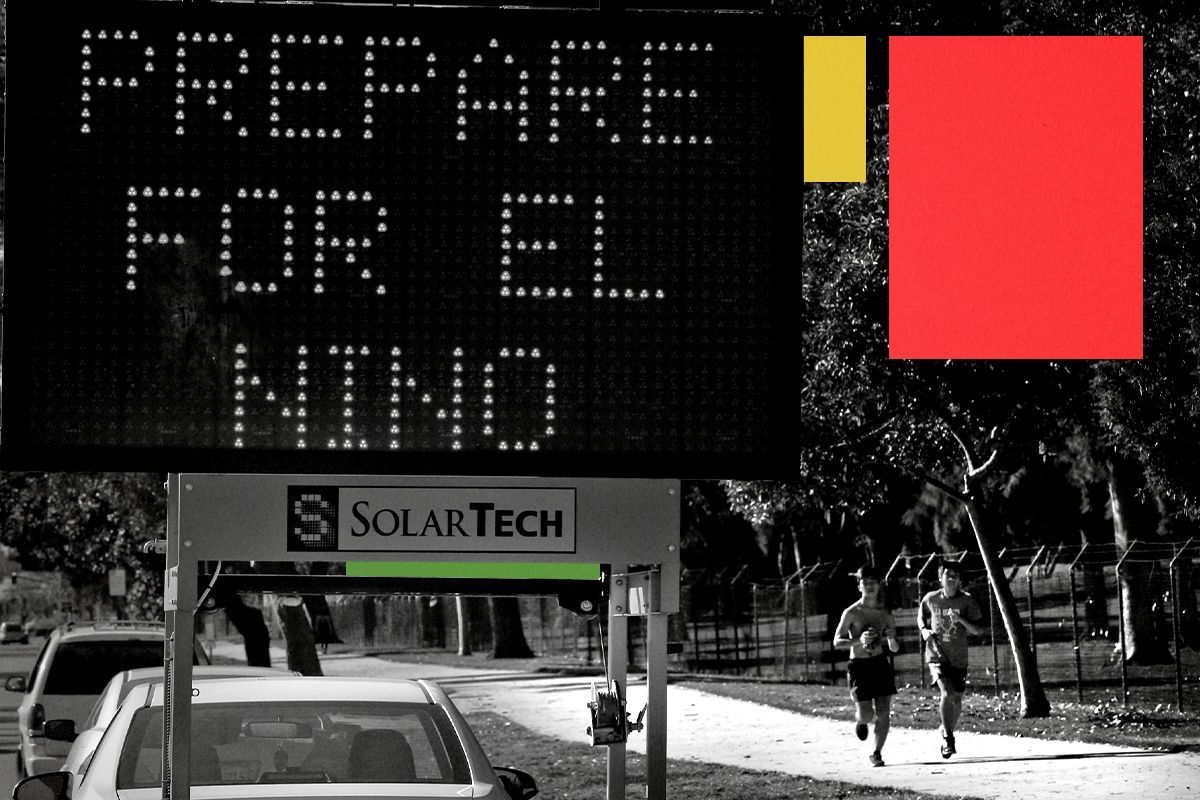
Every few years, the Pacific Ocean’s surface waters become especially warm near the equator, a climatic phenomenon known as El Niño.
El Niño is a normal part of the climate system, but even in a normal year, it can trigger extreme weather around the world. Forecasters are worried that the current El Niño — which just began a few weeks ago — is going to be anything but normal. Models suggest that we could soon see the hottest El Niño ever measured, with unpredictable and catastrophic effects for ecosystems and societies around the world.
What does that mean? And why does this El Niño look so bad? On this episode of Shift Key, Rob is joined by Zeke Hausfather, a climate research lead at Stripe and a research scientist at Berkeley Earth. They discuss what forecast models are saying about this El Niño, why it gives us a glance at the future, and whether climate change itself is accelerating.
Shift Key is hosted by Robinson Meyer, the founding executive editor of Heatmap News.
Subscribe to “Shift Key” and find this episode on Apple Podcasts,Spotify,Amazon, or wherever you get your podcasts.
You can also add the show’s RSS feed to your podcast app to follow us directly.
Here is an excerpt from their conversation:
Robinson Meyer: How much, at this point, are we in an El Niño that is record-breaking? Like, how much do we see in observations, physical observations of the ocean or the atmosphere and the rest of the climate system, and how much do we think from the models that it is going to get even hotter?
Zeke Hausfather: So the way that we track the strength of an El Niño — there’s a few different ways to track it. But the most common one is from this particular region of the tropical Pacific called the Niño 3.4 region, which is sort of like about a third of the way into the Pacific off the coast of Chile, right around the equator. And that’s where this tongue of warm water forms during El Niño events. That’s sort of the characteristic signal of El Niños. And temperatures in that region, as of today, are at 2.8 degrees centigrade above normal, normal meaning the average of the last 30 years. So it’s sort of a sliding window that tries to remove some of the human-caused warming.
Robinson Meyer: Are we comparing temperatures from that region to another region? Or they’re just in that region two or more degrees above normal?
Zeke Hausfather: So it’s a good question. The traditional way that El Niño has been defined is to just compare that region to itself, but with a 30-year moving average applied to remove the effects of human-caused warming. There is another metric that was introduced by NOAA last year called the Relative El Niño Index, which is a variant where you sort of subtract out the average over the tropical ocean as a whole from that region, so you’re looking at the difference between that region and the rest of the tropics.
There’s pros and cons of that approach. Arguably, it removes the human warming signal a bit better, but it also can overly penalize really strong El Niño events that reach outside of that region because they start warming the whole tropics. So anyway, the details are technical, but the point on the observations is that we’re already seeing a very strong event occurring there today. You know, temperatures as of today, when we’re recording, August 10, are 2.8C above normal. To put that in perspective, the strongest ever anomalies we’ve recorded, at least daily in the satellite record since the 1980 or so, were in 2015, 2016, and those were about 3.1 degrees above normal. And so as of today, by itself, it would be the third strongest El Niño signal ever recorded in that region.
But what’s different is that El Niño almost always peaks near the end of the year. So if you look at all the El Niño events on record, there’s been one or two that have peaked in October, but the vast majority peak in November or December, and a couple as late as January. It’s a very persistent pattern of these events. And so the fact that it’s only the beginning of August now and we’re already at this extremely high level, we’re essentially running two to three months ahead of any other El Niño on record in terms of how quickly it’s developing, which is one of the reasons why we’re increasingly convinced that this is going to be a record-setting event. It’s going to blow any event we’ve seen previously out of the water. And if you look at the latest models that came out this morning, actually, it’s good timing. They’re predicting a peak of around 4C in the Niño 3.4 region, which will be, you know, more than a degree above the previous record and could end up being the strongest El Niño in 500 or 1,000 years. We don’t have great proxy estimates going back, but, it certainly is something well outside of anything we’ve seen since records began in 1850.
Robinson Meyer: The swimmer Katie Ledecky swims a race sometimes in the Olympics and she’ll be out swimming and then behind her there’s a computer-generated line which is the current world record, and she’s way out in front of the current world record, and you’re watching her and then she does she turns around in the pool and then the world record is behind her. That is the current El Niño. This is the Katie Ledecky-style El Niño.
You can find a full transcript of the episode here.
Mentioned:
NOAA’s El Niño page and the relative El Niño index
An Assessment of Earth's Climate Sensitivity Using Multiple Lines of Evidence, the 2020 paper where Zeke was a coauthor
Zeke’s blog post on AI emissions: The real energy use of agentic AI
John Bistline’s post on AI emissions at Watershed
Heatmap’s coverage of AI emissions: A New Guesstimate for Corporate AI Emissions
This episode of Shift Key is sponsored by ...
Discover the Yale Clean and Equitable Energy Development online certificate program at the Yale Center for Business and the Environment. In this fully online, 5-month program, you’ll learn from leading experts, develop practical skills, and grow a powerful network. Visit cbey.yale.edu to learn more and apply.
Music for Shift Key is by Adam Kromelow.