0

The timing was terrible. In December, just as the Canadian developer Hut 8 was preparing to ask regulators in a rural county of central Illinois to rezone an open stretch of land to make way for a data center, Americans’ support for the computing infrastructure expansion was plummeting, with voters blaming the big tech projects for driving up electricity costs.
The optics turned out to be even worse. The location Hut 8 selected was right next to the local electricity substation, making it easy to see the project as an industrial parasite glugging down electricity at the source and letting what remained trickle out to Logan County’s roughly 28,000 residents. When the county held a public hearing on the rezoning proposal in January, 250 residents showed up in protest and repeatedly cited the data center’s potential location next to the substation.
“It immediately raised red flags. You can picture this massive thing sitting next to the substation, sucking up all the power before it gets to the community,” Charlie Clynes, a data analyst for Heatmap Pro who has tracked the project, told me. “Obviously that’s not exactly how things work, but the imagery there was arresting.”
It also wasn’t entirely off base. Data center development can hike electricity bills in a variety ways, including by stressing existing generation resources and by demanding costly new infrastructure buildouts. Data from Heatmap and MIT’s Electricity Price Hub shows that the price of electricity in the county may, indeed, have played a role in hiking prices enough to spur a movement against the project: Between 2020 and 2026, generation costs roughly doubled.
Scenes like the one in Logan County are playing out across the country as the advent of artificial intelligence coincides with rising electricity prices and threatens to create a demand crisis.
But opposition to AI doesn’t always correlate with rising electricity prices.
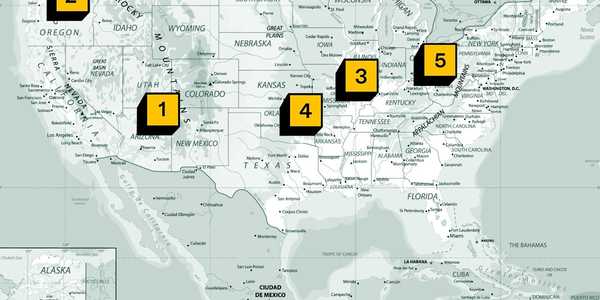
Logan County earned a score of 69 on Heatmap Pro’s data center opposition index, which incorporates everything from real-world project outcomes to about 100 input variables, including economic, demographic, and geographic characteristics to quantify the likelihood that a project will face pushback in a given area. Nearly 70 might sound high, but it puts Logan County just outside the 100 counties most opposed to data center development.
In Botetourt County, Virginia, which topped the data center opposition index with a score of 101, residents are engaged in an active fight against a planned Google data center. Data from the Electricity Price Hub shows that the cost of generation surged 45% from 2020 to 2026, transmission spiked 29%, and distribution surged roughly 90%. The broad category of “other” — a category that includes miscellaneous expenses such as taxes, regulatory fees, insurance, and payroll (as Heatmap’s Jeva Lange explained here) — rocketed up by more than 104%. But here’s the rub: Botetourtians cite water usage as a top concern about data center development, not necessarily electricity prices.
In Bartow County, Georgia, which tied with Rogers County, Oklahoma, for second place on the index, generating costs rose by more than a third from 2020 to 2026, from $0.07 per kilowatt-hour to $0.09, leading to a total bill increase of nearly 30%. (You can find out more on the difference between electricity prices and bills from my colleague Emily Pontecorvo.) Rogers County, similarly, saw a roughly 50% spike in generation costs and an increase in transmission and distribution costs of more than a third each.
Hendricks County, Indiana, where residents unsuccessfully battled to stop a 600-megawatt AI data center from coming to fruition, came in ninth place on Heatmap Pro’s opposition index. Sure enough, the data shows a roughly 140% surge in distribution costs on ratepayers’ bills from 2020 and 2026, from $0.10 to $0.30 per kilowatt-hour.
In Cass County, Michigan, by contrast, distribution costs ticked up only slightly in recent years. Yet the county, which ranked seventh on the opposition index, is facing fierce opposition to a 340-megawatt AI data center proposed in the area, highlighting the inconsistent role electricity prices play in opposition movements.
Heatmap Pro also tracks opposition to renewables development, which is often the cheapest and fastest way to add power to the grid amid surging demand. The top of the list is a 63-way tie, mostly involving counties in the Central and Upper Midwest.
Then there’s Somerset County in Maine, which has been home to various utility-scale wind and solar developments in recent years. The cost of distributing power there has roughly doubled for customers of the three utilities serving the county, from $0.35 per kilowatt-hour at the start of 2020 to more than $0.63 by this January. Many Mainers blamed the state’s renewable energy goals for the spike in prices, but price hub data confirms the conclusions of a report from The Brattle Group released in February, which blamed the state’s reliance on natural gas, as well as the cost of repairs and upgrades to an aging grid.